
Grafana is a data visualization and analysis tool that allows you to create interactive dashboards from multiple data sources.
With Grafana, you can create charts, alerts, and custom panels that help you better understand data and make informed decisions.
It is compatible with a wide variety of databases, including Prometheus, InfluxDB, Elasticsearch, and many others.
It is widely used for system monitoring, metric visualization, and data analysis.
How to Install Grafana
Before installing Grafana, it is recommended that your system is up to date. To update your system, run:
sudo apt update sudo apt upgrade
Now we need to add the Grafana repositories. First, we add the APT keys to authenticate the packages.
sudo mkdir -p /etc/apt/keyrings/ wget -q -O - https://apt.grafana.com/gpg.key | gpg —dearmor | sudo tee /etc/apt/keyrings/grafana.gpg > /dev/null
Add the Grafana repository.
echo “deb [signed-by=/etc/apt/keyrings/grafana.gpg] https://apt.grafana.com stable main” | sudo tee /etc/apt/sources.list.d/grafana.list
Finally, we can now install Grafana.
sudo apt update
sudo apt install -y grafana
Now we need to configure the Grafana service and enable it to start automatically when the Raspberry Pi boots:
sudo systemctl start grafana-server sudo systemctl enable grafana-server
We can verify that the installation is correct with the following command.
sudo systemctl status grafana-server
If everything is fine, we should see output indicating that the service is active and running.
Access the Grafana Web Interface
Grafana runs through a web interface, which runs by default on port 3000. Open a web browser and access the Grafana interface.
127.0.0.1:3000

When you access it for the first time, you will be prompted to log in. The default credentials are:
- User: admin
- Password: admin
The first time you log into Grafana, it will ask you to change the administrator password. Enter the password you want and then click “Change Password”.
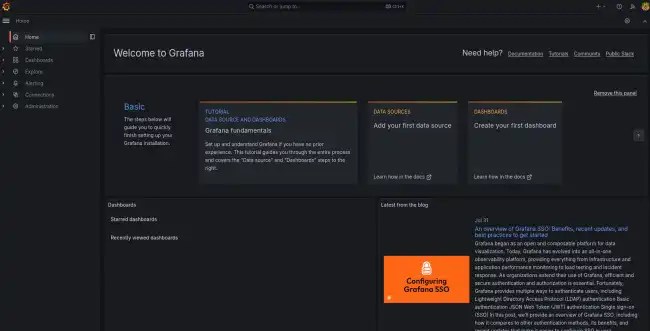
Once inside, you can start configuring your datasources and dashboards.
Configure a DataSource
To be able to visualize data in Grafana, we must first connect it to a data source. Grafana supports a wide variety of data sources, including Prometheus, InfluxDB, and Graphite.
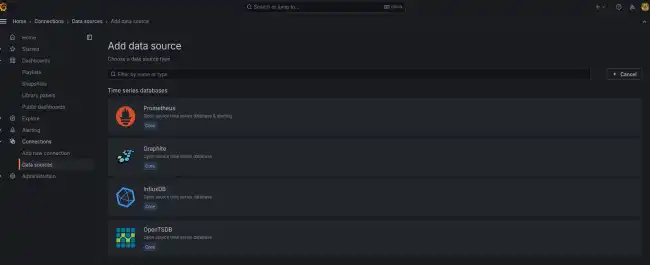
To connect Grafana to a data source:
- Go to the configuration page
- Click on “Add data source”.
- Select the type of data source you want to use
- Follow the instructions to configure the connection
Example with InfluxDB
Let’s see it with an example, along with an InfluxDB database. It’s the typical setup from all the tutorials, I know you love the Grafana + InfluxDB combo.
If you don’t know what InfluxDB is or how to use it, I leave you this tutorial.
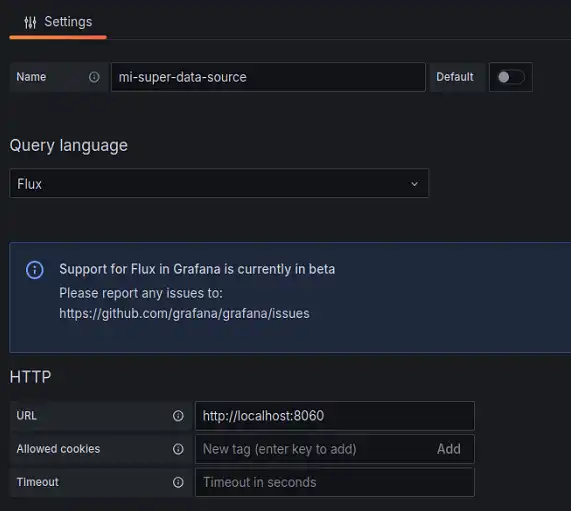
Select to create a new DataSource, and choose InfluxDB. Here we change the following:
- Name: Whatever you want
- Query language: Flux
- URL: http://localhost:8086
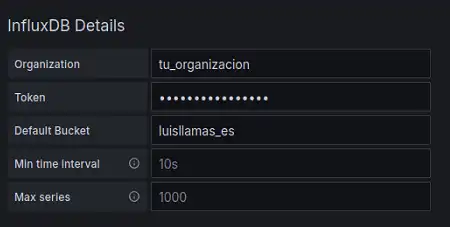
Further down, in authentication:
- Organization: The one you set in InfluxDB
- Token: The token that InfluxDB gave you
- Default Bucket: The name of the bucket (database) you want
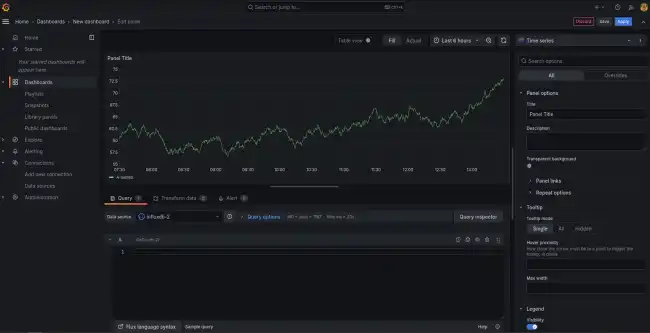
Creating a Basic Dashboard
Once we have connected Grafana to a data source, we can start creating dashboards and visualizations. Grafana comes with an easy-to-use panel editor that allows us to add charts, tables, and other visualizations to our dashboards.
To create a basic dashboard:
- In the Grafana interface, click the + sign in the side menu and select “Dashboard”.
- Add a new “Panel” and select the data source you have configured.
- Configure the visualizations and charts according to your needs.
That’s how easy it is to create a dashboard! Go on, go create your charts and screens like crazy 😘