Let’s see how to create a new project in C++ using Visual Studio Code, how to run it, and how to debug it.
Once we have VS Code installed, the compiler, and the extensions installed, we create a new folder for the project (to better organize your project) and open this folder in VSCode with File > Open Folder.
Now we create a new C++ file by clicking on File > New File (or pressing Ctrl+N), named main.cpp (for example).
In this file, paste this code.
#include <iostream>

int main() {
    std::cout << "Hello, world in C++ from LuisLlamas.es!" << std::endl;
    return 0;
}
We will see each line in detail later. For now, don’t worry, we are just setting up the environment.
You now have a very simple program. Now let’s run it 👇.
Run the code
From VSCode
To launch our code from Visual Studio Code, we press F5. The first time, a dropdown will appear to choose the debugger.

Select C++ (GDB/LLLDB) and another dropdown will appear to choose the configuration.

Here we choose C/C++ g++ build and debug active file and (finally) the program will run.
In the Terminal tab, you will see the output of the program (which includes a command with several lines). And at the end, the message in the output.
Hello, world in C++ from LuisLlamas.es!Congratulations, you now have VSCode configured to work with C++ 🎉.
The next times you want to run the program, just press F5, and it will launch without having to choose anything from dropdowns.
From the terminal
Alternatively, if you want to compile manually, you could do it this way. First, we compile the code using GCC with the following command:
g++ hola_mundo.cpp -o hola_mundoNow it will create an executable file, which we can run (of course, because it is executable 😆)
hola_mundo.exe./hola_mundoConfiguration of build and run tasks
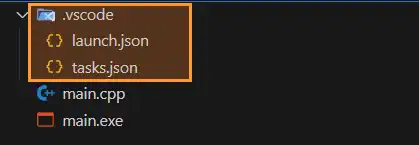
The configuration of VSCode for building and debugging is based on two files tasks.json and launch.json, which are saved in the project folder (in the subfolder .vscode).
- tasks.json: Configures automated tasks (for example, compiling code).
- launch.json: Configures the debugger and program execution within VSCode.

The Tasks.json file
The tasks.json file is used to define automated tasks that you can run within VSCode.
Tasks can be any process you want to automate in your workflow, such as compiling code, running tests, or any other terminal command.
By doing the previous process, it will create one that looks something like this:
{
   "version": "2.0.0",
   "tasks": [
	   {
		   "type": "cppbuild",
		   "label": "Compile C++",
		   "command": "g++",
		   "args": [
			   "-fdiagnostics-color=always",
			   "-g",
			   "${file}",
			   "-o",
			   "${fileDirname}/${fileBasenameNoExtension}.exe"
		   ],
		   "group": {
			   "kind": "build",
			   "isDefault": true
		   },
		   "problemMatcher": ["$gcc"],
		   "detail": "Compiles the current C++ file"
	   }
   ]
}
In this configuration, it currently does:
- Compiles the current file
- Generates an executable in the same folder.
Some of the parameters we can adjust are:
| Field | Description |
|---|---|
label | The name of the task (you can use this name to run it) |
type | The type of task (can be shell, process, etc.) |
command | The command that will be executed (for example, the compiler g++) |
args | The arguments passed to the command (for example, input and output files) |
group | Indicates that the task is part of the “build” group (compilation), and you can mark it as the default task. |
Launch.json file
The launch.json file is used to configure the debugger in VSCode. Initially, this step is optional (we will use it when we want to configure advanced parameters in the debugger).
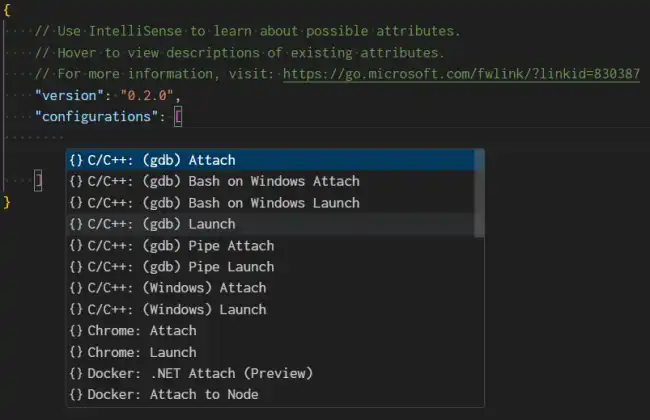
To do this, we go to Run > Add Configuration…. It will create an empty launch.json file. We can add configurations by clicking the Add Configuration... button.

The file will look something like this:
{
    "version": "0.2.0",
    "configurations": [
        {
            "name": "(gdb) Launch",
            "type": "cppdbg",
            "request": "launch",
            "program":  "${fileDirname}\\${fileBasenameNoExtension}.exe",
            "args": [],
            "stopAtEntry": false,
            "cwd": "${fileDirname}",
            "environment": [],
            "externalConsole": false,
            "MIMode": "gdb",
            "miDebuggerPath": "gdb",
            "setupCommands": [
                {
                    "description": "Enable pretty-printing for gdb",
                    "text": "-enable-pretty-printing",
                    "ignoreFailures": true
                },
                {
                    "description": "Set Disassembly Flavor to Intel",
                    "text": "-gdb-set disassembly-flavor intel",
                    "ignoreFailures": true
                }
            ]
        }
    ]
}
For it to work for you, you will need to adjust the parameters
In particular, in this example, you will need to change this line:
"program": "enter program name, for example ${workspaceFolder}/a.exe",To the path where you have saved the file in the Tasks.json file:
"program": "${fileDirname}\\${fileBasenameNoExtension}.exe",Some of the parameters in the launch.json file are:
| Field | Description |
|---|---|
program | The executable that will be run (for example, the compiled main file) |
args | Arguments that will be passed to the program when it runs (in this case, none) |
stopAtEntry | Whether to stop execution at the start of the program |
preLaunchTask | Here you can specify a task that will run before starting the debugging (for example, the build task defined in tasks.json) |